5 Reasons to Learn D3.js
The JavaScript library D3.js is arguably the most influential tool for creating interactive data visualziations. This post focuses on what D3 is and why you should learn it. Oh and koalas. This post is also about koalas. And lots of eye candy.
D3 stands for Data-Driven Documents and is widely used to create interactive data visualizations on the web. Its main author, Mike Bostock, is a New York Times graphics editor. In other words, D3 is used by top people in the field.

Learning D3 is ideal for people who also want to develop web development and some JavaScript programming skills. There are other web visualization frameworks, so below are top 5 reasons why D3 is so great. The next post will focus on how to learn D3.
Learning D3 can take time, especially if you have no prior web development experience. Hence, D3 is probably not for people who want to just quickly expand their visualization skills. (But there are other pathways for learning interactive visualization skills.)
[RELATED POST: Two Routes For Learning Interactive Data Visualization]
But don’t let that scare you away just yet. You haven’t even gotten to the koalas! So check out the eye candy below, regardless of what learning pathway you choose. Now back to the top 5 reasons for learning D3…
1. Lots of examples.
Here’s a secret (sssh!) about creating great data visualizations: take ideas from other examples you’ve liked! That’s often the most effective way to make you look like and become a master data visualizer.
Remember that scatterplot visualization on my first blog post? Think I created that from scatch? Pssh, as if! Karl Broman’s initial code served as the basis for that project.

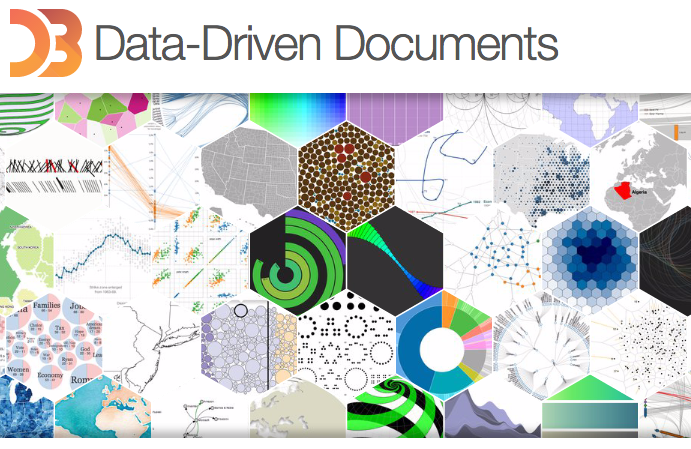
And that’s the great news about D3: there are thousands - thousands! - of great D3 examples to work from. That scatterplot example? Yup that was D3. The New York Times’ 512 paths to the White House visualization? Yup D3. Visualization of gendered language in RateMyProfessor reviews? You should know the answer by now.
See excellent curated lists of D3 examples here and here. Many of these examples are posted online because developers want others to re-use their code. Just be sure to give credit where credit is due :)
2. Vibrant open-source community.
When I have a question about D3 (“How do I use D3 together with Leaflet???”), I often Google the issue and then quickly find a great StackOverflow or blog post that addresses it. These extensive (free!) resources are available because of the very large and vibrant open-source community behind D3.
D3 has been forked over 9,000 times on Github, meaning that other developers are also constantly extending D3. For instance, third-party “wrapper” libraries such as NVD3 and Vega aim to speed up development time for creating common types of D3 visualizations. These wrapper libraries sometimes have limited customizability, but that may not be a concern depending on the project.
3. Seriously, so many examples.
OK enough text for now. More eye candy! Remember the promise of koalas? Well find them by splitting circles with your mouse cursor below. All the examples below used D3.
The showreel below is also gratuitous eye candy, but also shows a range of charts for showing time series comparisons (original link).
I find these wind patterns beautiful and easy to understand (original link). The New York Times also used this idea to show changing U.S. presidential voting patterns.
I was suprised to see how lopsided PAC contributions were to some individual senators: click the “Senate” button in the upper left-hand corner to see (original link).
Refresh this page to re-watch an animaion of these cross-national data below (original link). Also, see the most adorable Swedish man describe these data in this TED talk.
4. Knowing D3 = hirable skills.
Because D3 is so widely used, knowing it makes you more hirable for tech jobs. Don’t believe me? Just check out these job lists here, here, and here.
And even if a job doesn’t specifically ask for D3 skills, think about how you could leverage that experience anyway in an interview. For instance, D3 can be used to improve a company’s website or communicate complex data to business partners and investors.
5. Opportunity to learn web development skills.
When learning D3, you learn many other web skills involving JavaScript (known as the “programming language of the web”) and HTML. Even if you decide you hate D3, knowing those skills will be useful in any other project involving web development.
You learn these broader skills because D3 exposes you to the internals of a webpage. In more technical terms, D3 doesn’t use an “intermediate” representation. It instead directly manipulates elements on the Document Object Model (DOM), which is basically just a fancy term for everything that is currently shown on a webpage.
Not all JavaScript libraries are like D3 in this regard. Case in point: I was working with Leaflet the other day, which is a JavaScript library for making pretty maps. I thought its circle function would make “circles” on the webpage. Silly me, it actually makes “paths.” Confused? Don’t worry, so was I.

The same confusion doesn’t happen with D3. When you append a “circle” using D3, you really are adding a “circle” to the webpage, not some mischievous “path” masquerading as a “circle.” I’ll talk more about this in the next post about how to learn D3!
Bottom line: you learn a lot about foundational web skills when learning about D3, unlike some other visualization frameworks.